Performance Overview
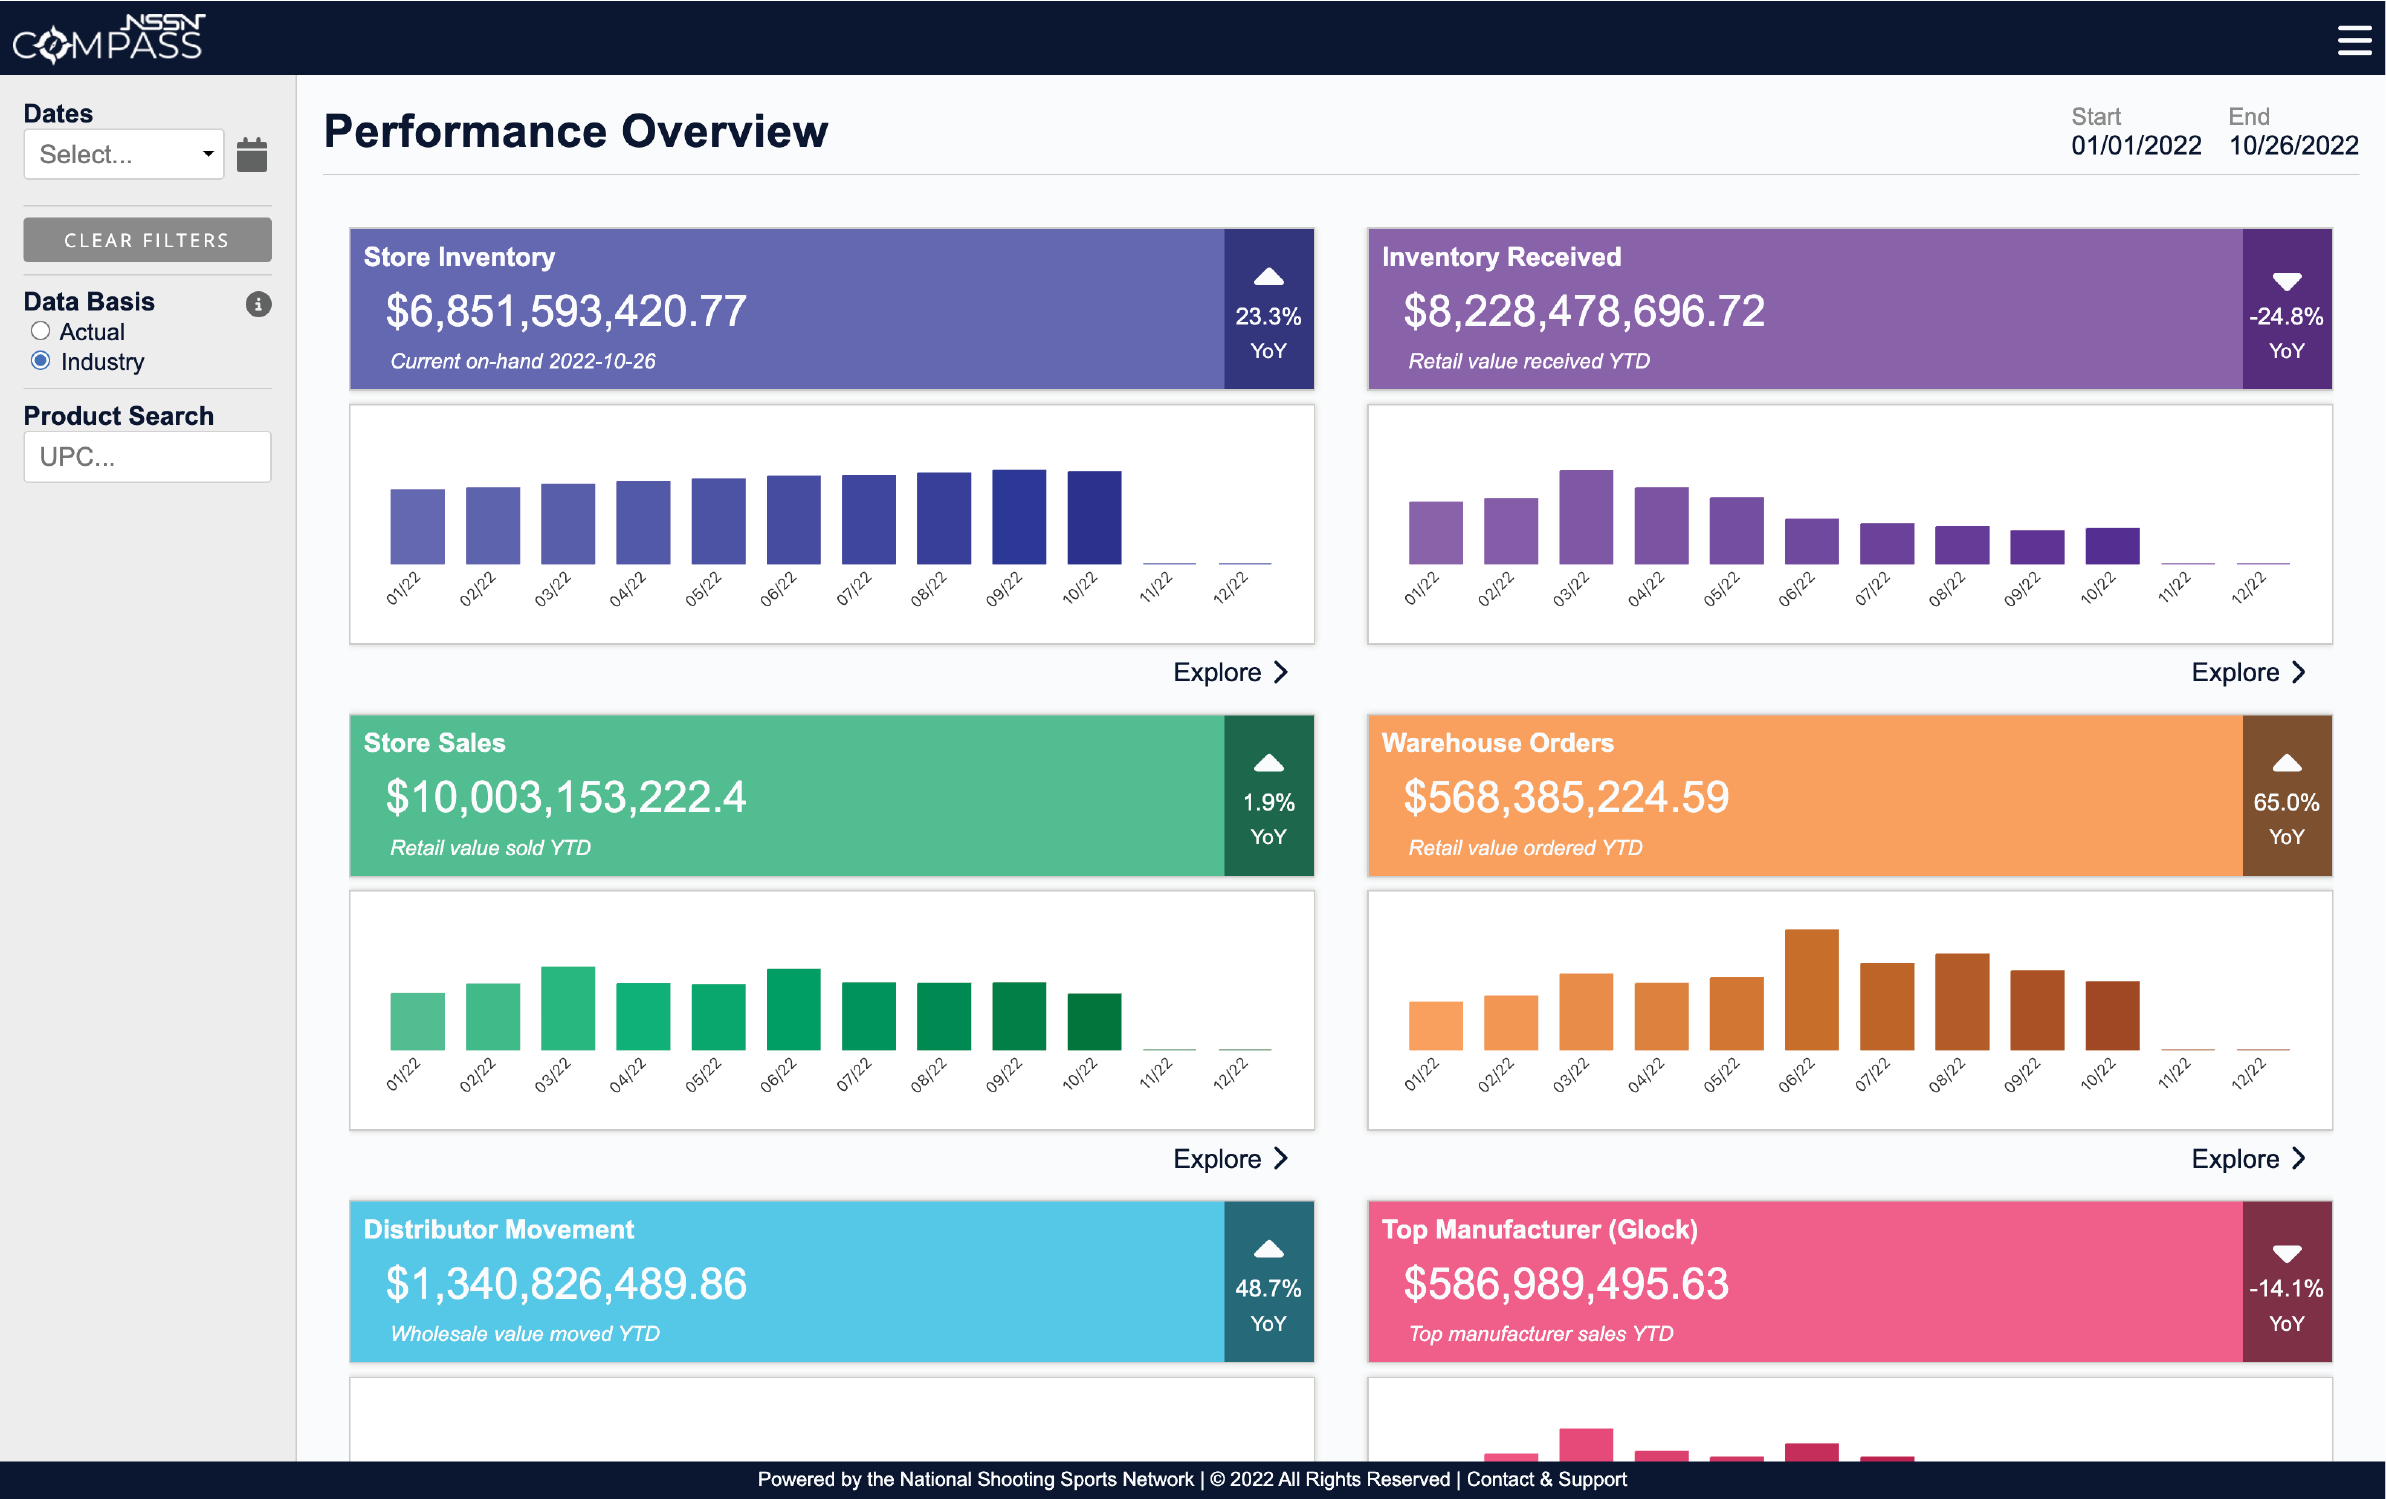
Paint a complete picture of the industry with sales, inventory, and supply chain movement.
See a quick real time snapshot of the entire industry
Actual Data — comes from a sample of the largest database of real POS dealers in the country.
Industry Data — comes from Actual Data combined with known and established industry data, extrapolated using computer algorithms into a complete industry estimate.
Real Time Inventory Trends
Data must be REAL TIME to be actionable.
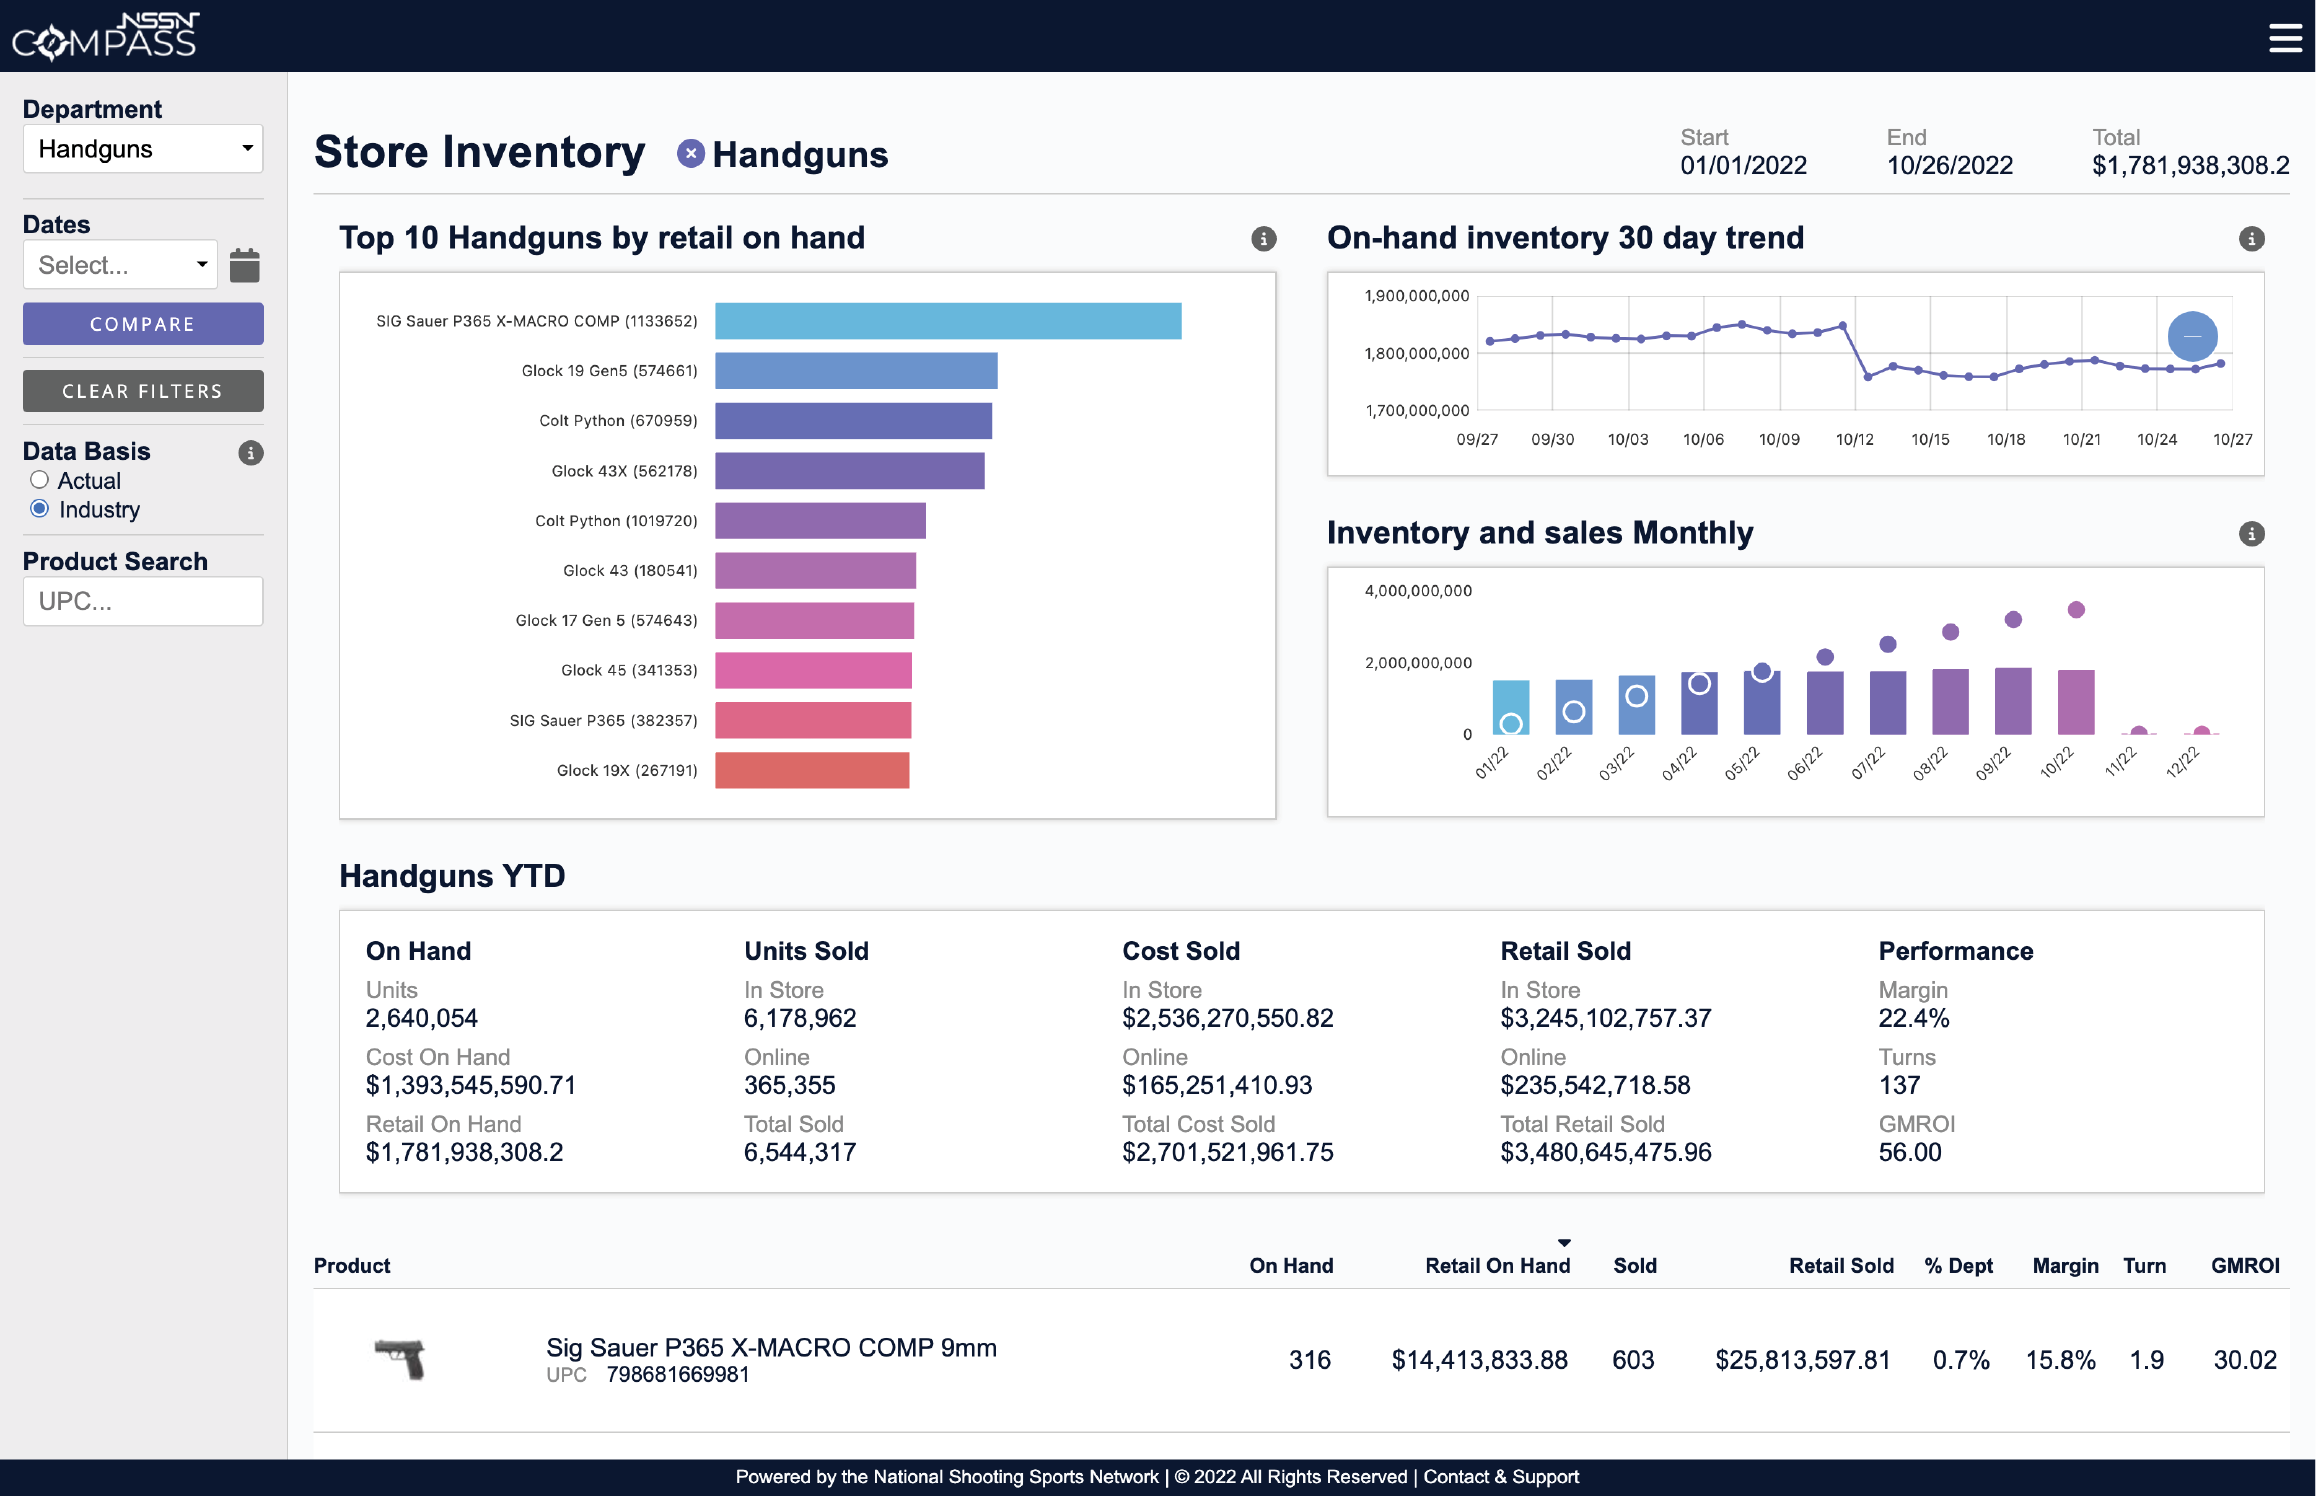
View real time dealer & industry inventory data by department.
Real time inventory data is available by day, week, month, quarter, and year.
View inventory data by SKU, manufacturer, sales, inventory, turns and GMROI.
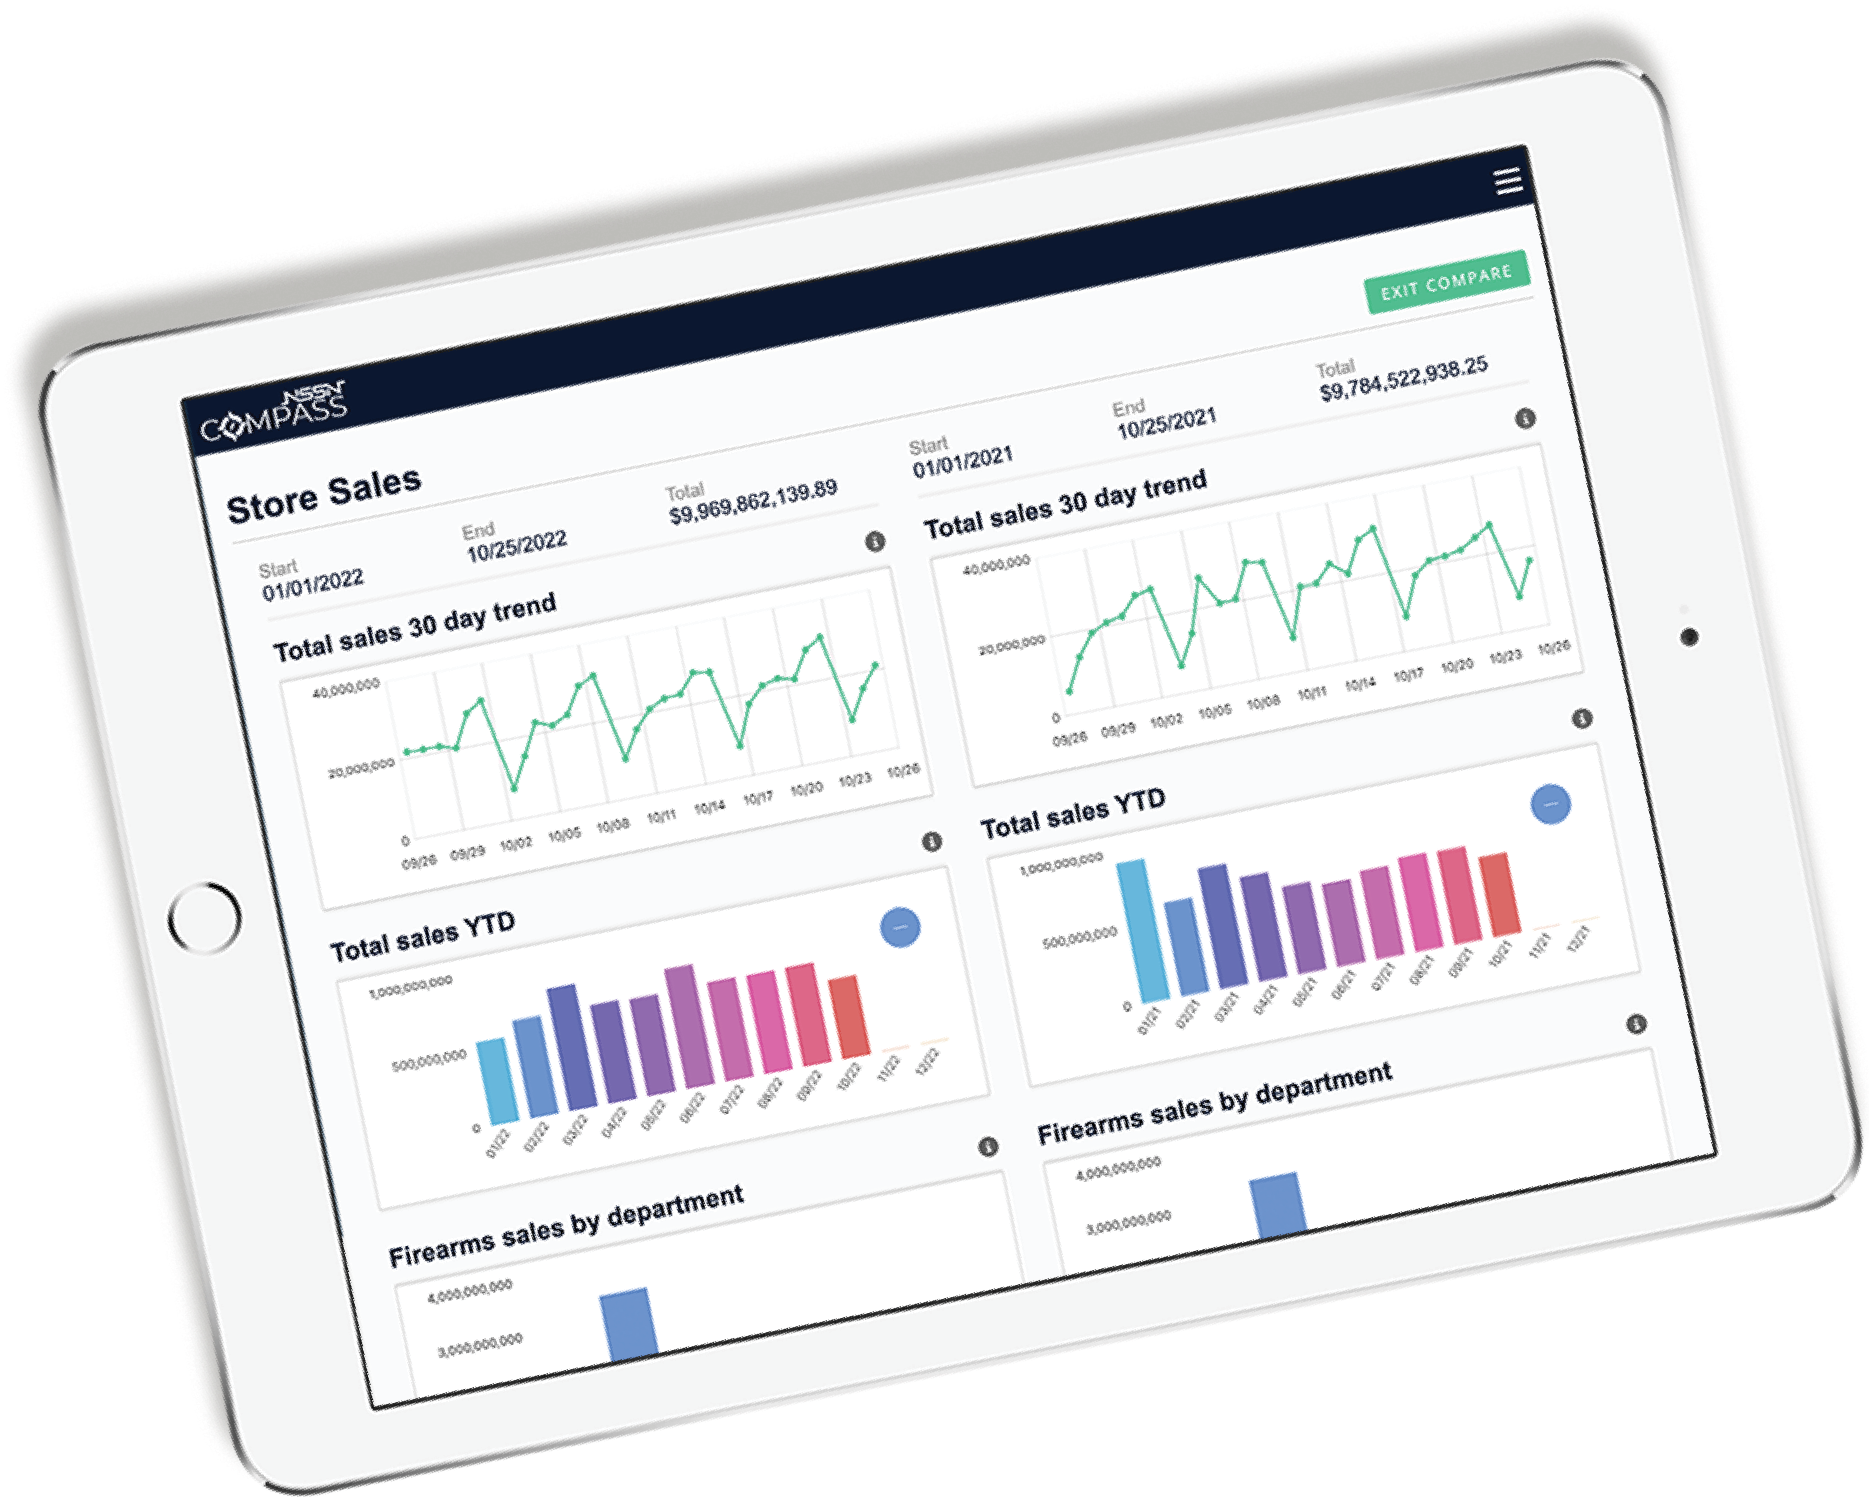
Compare dealer and industry performance over time, with last 30 day trends and side-by-side TY/LY views.
Suppliers & Inventory Received
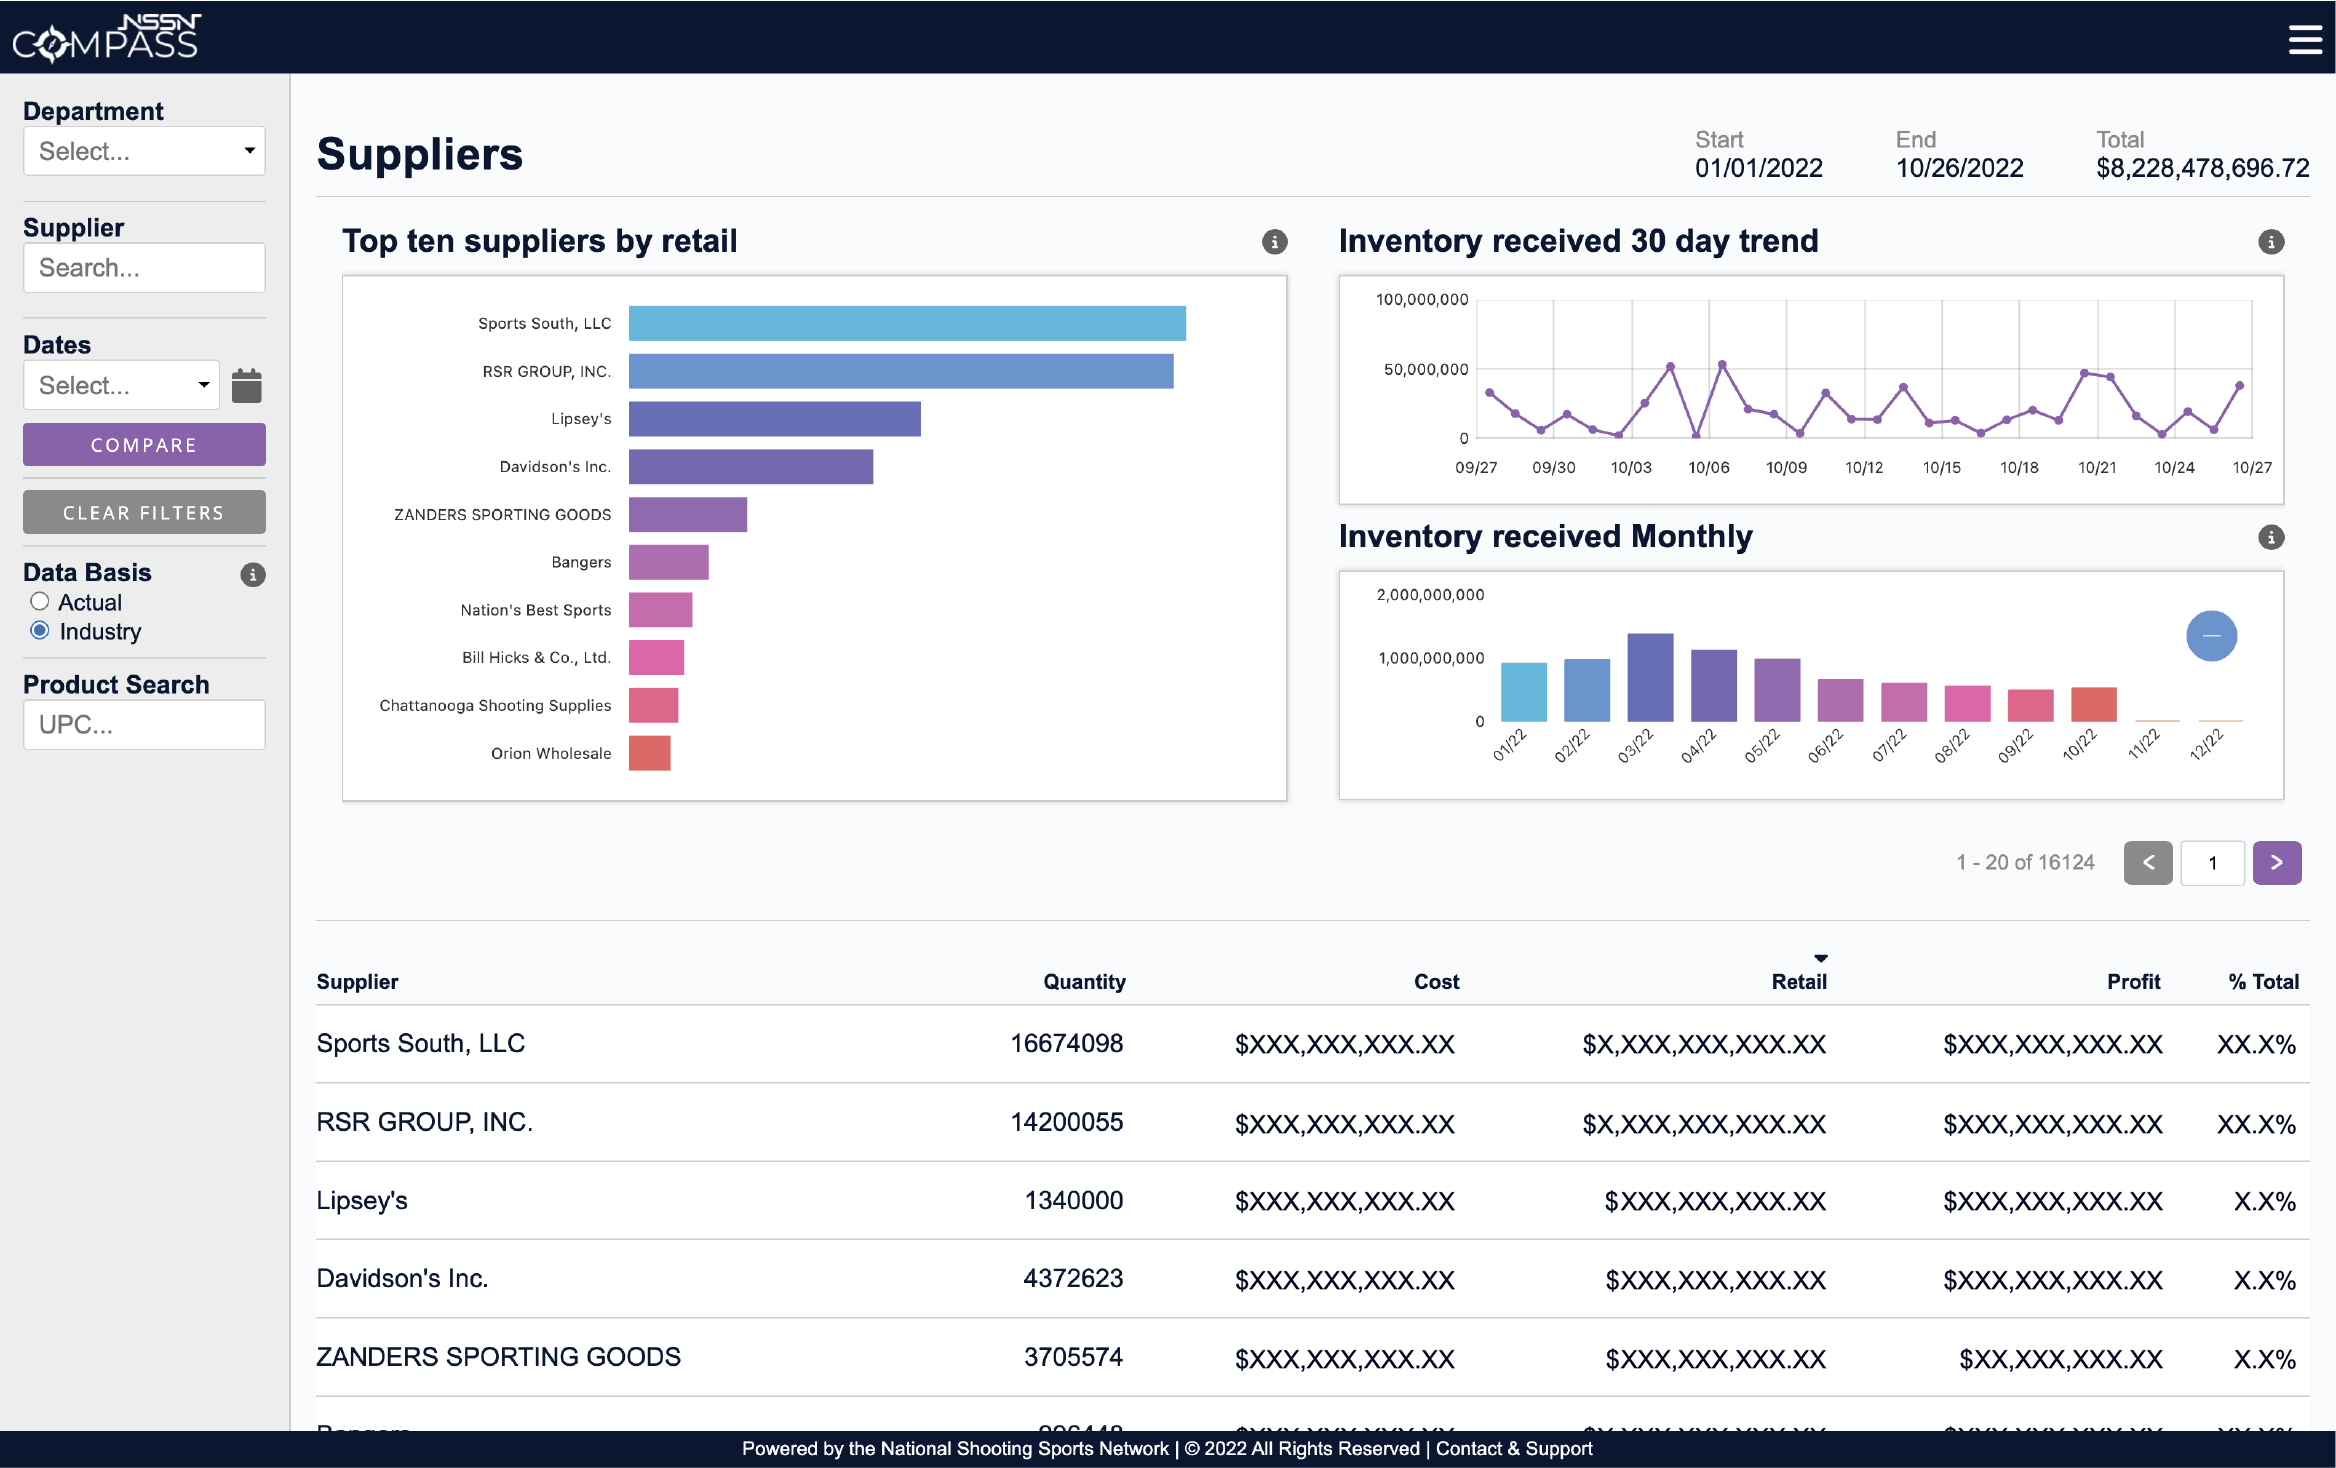
View a more complete picture of the overall industry supply chain.
View industry suppliers by market share.
View supplier performance in real time, over time, and by department, down to the product SKU level.
Know product origination by supplier
Dealer & Industry Sales Performance
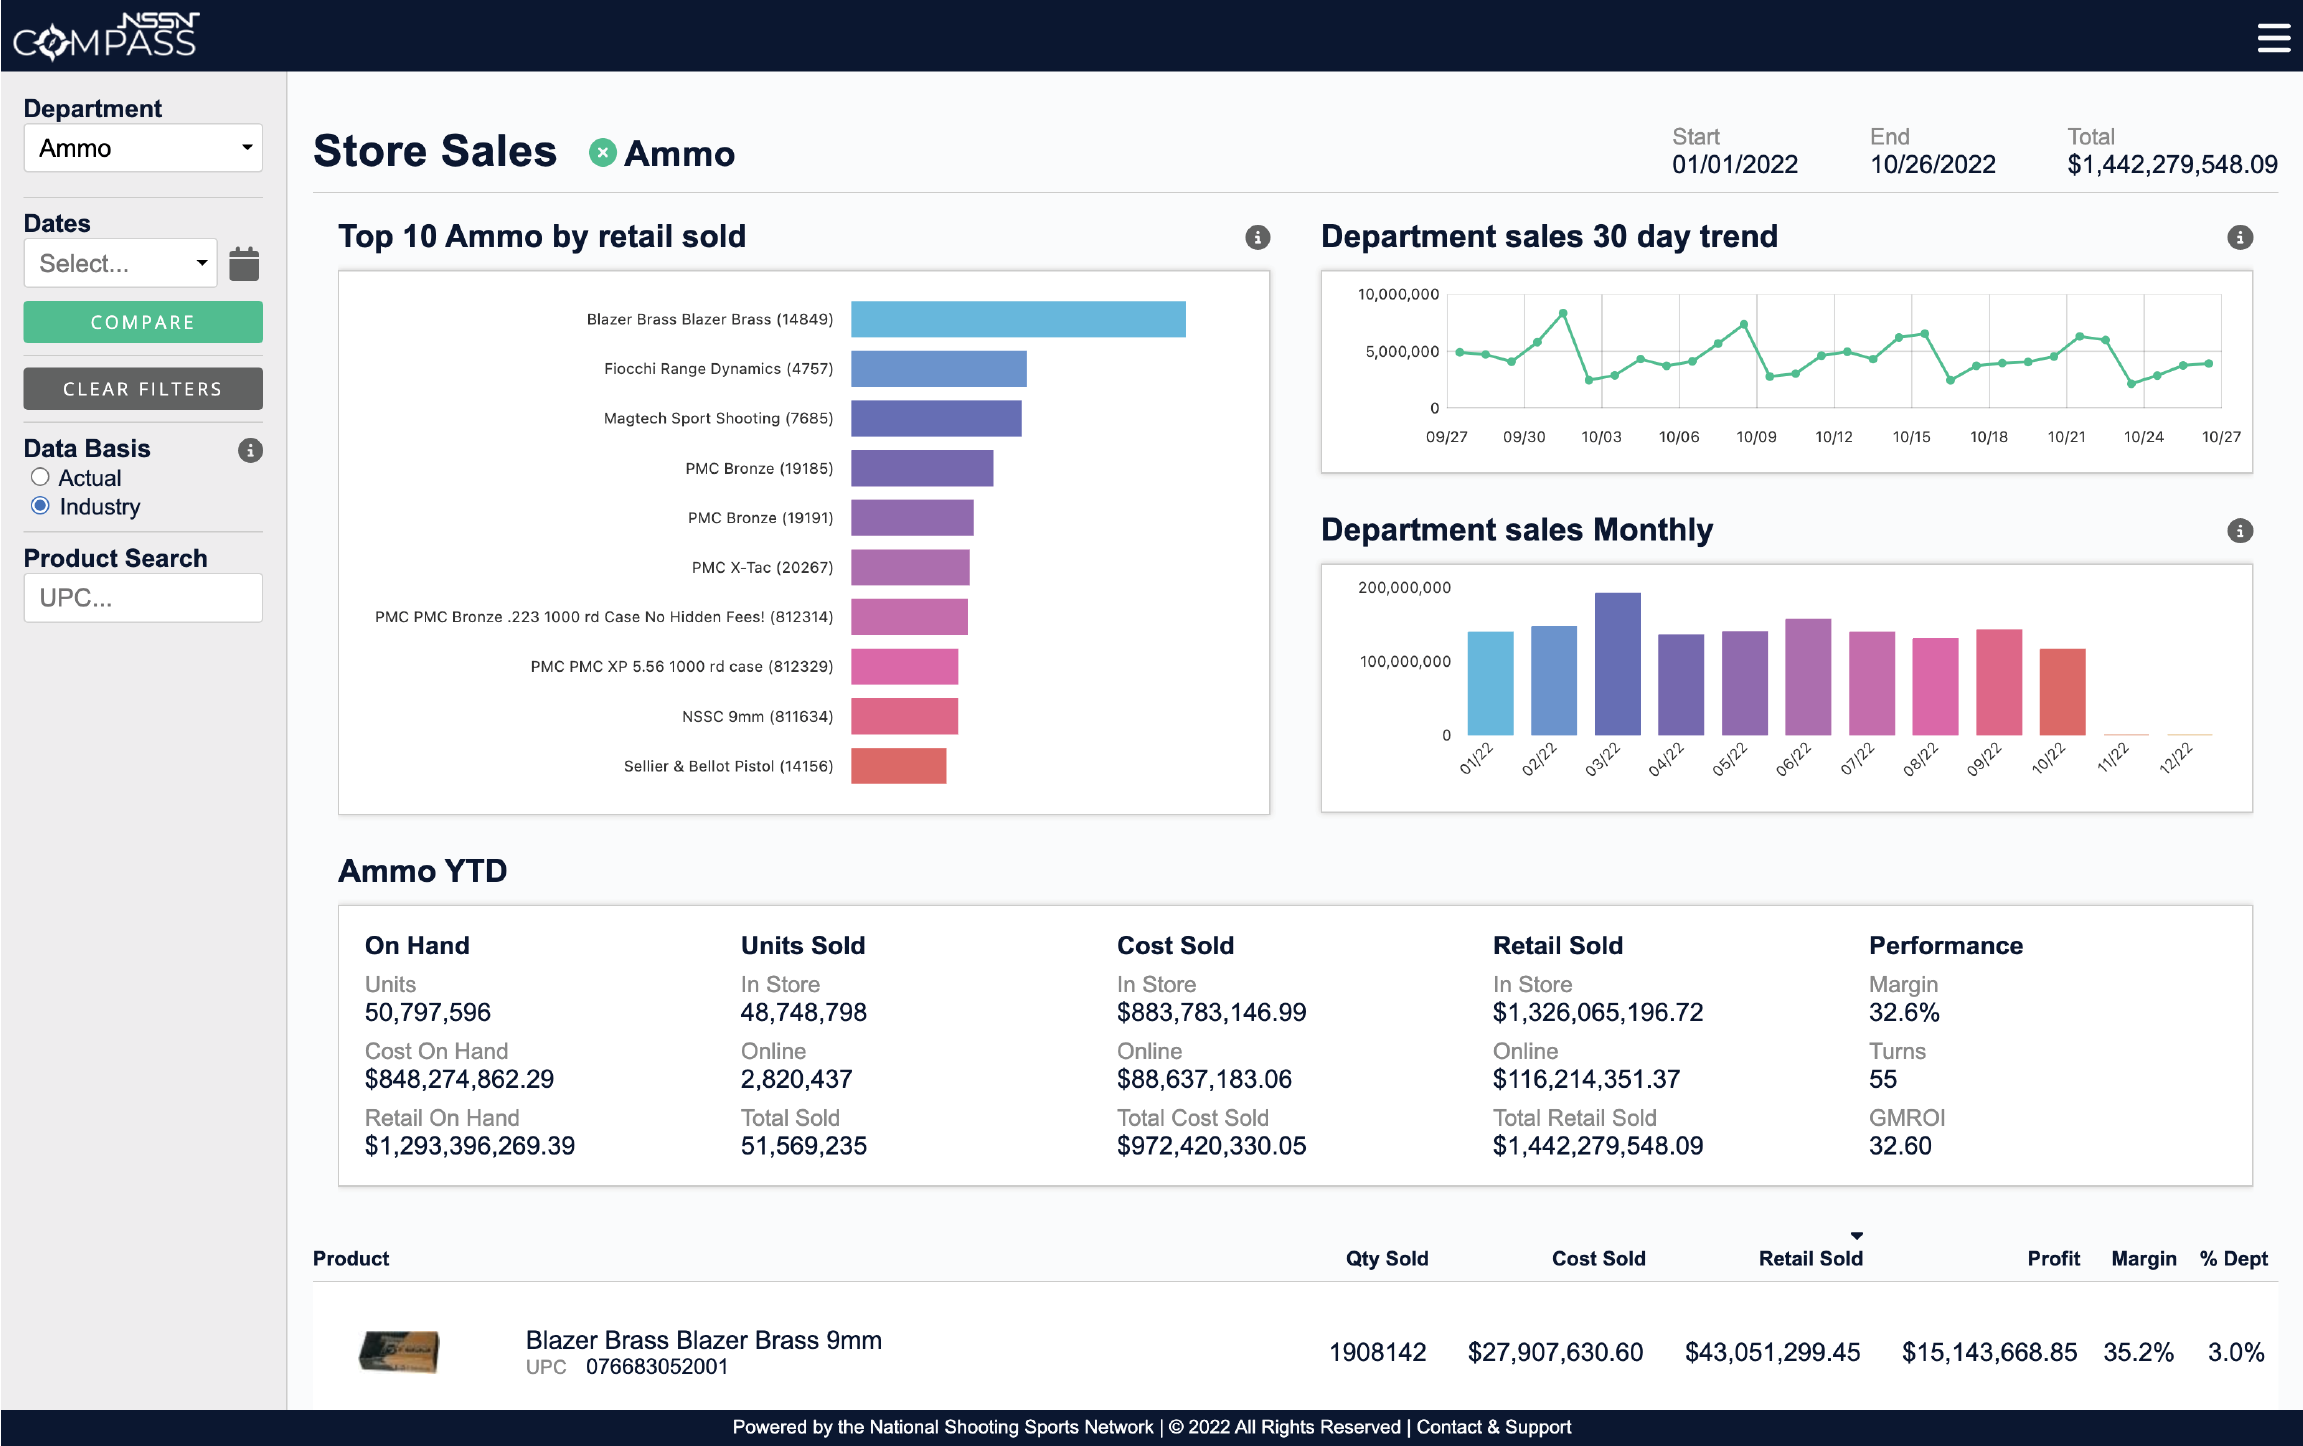
View dealer & industry sales by department, product, in real time, over time, with trends, and compare TY/LY.
View sales by department, SKU, margin, and percent of total sales, with comparisons of TY/LY.
View sales by origin point: online vs in-store.
View sales performance in real time and over time by cost, retail, turns, margin, and GMROI, with TY/LY comparisons.
Manufacturer Performance
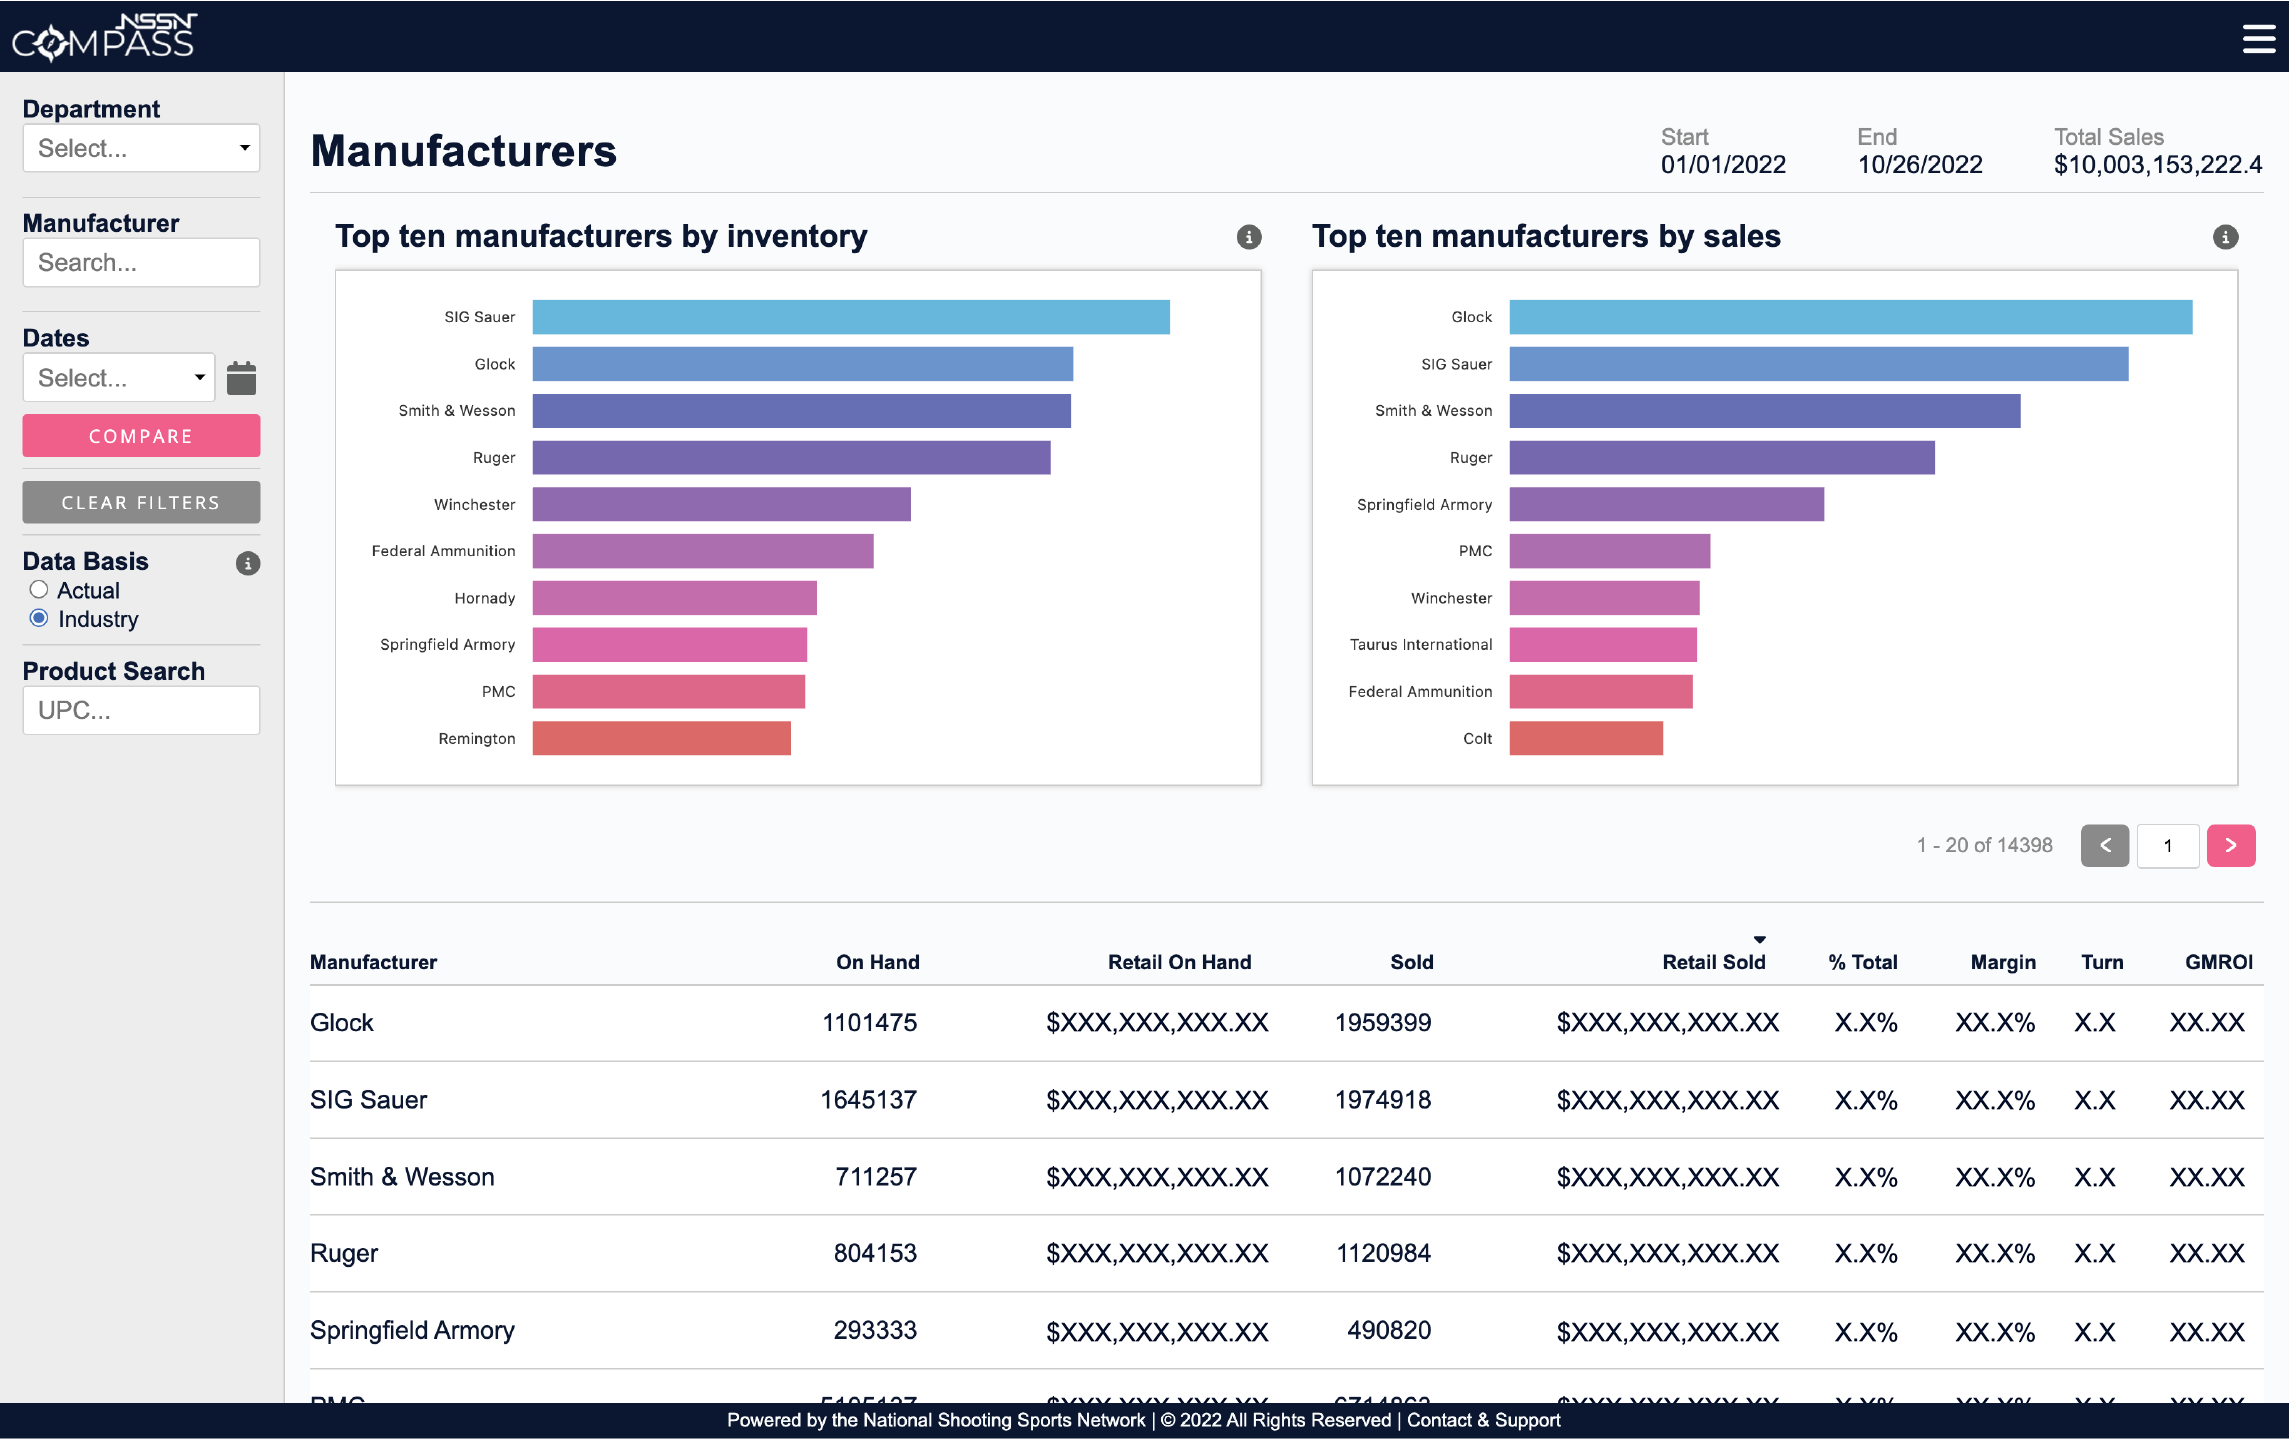
View performance by actual data and total industry estimates.
View all manufacturers by industry rank for inventory, sales performance, and profitability.
View sales and inventory by manufacturer as a percent of the industry, by margin, and GMROI.
View manufacturer performance in real time and over time by department, down to the SKU level and compare trends TY/LY.


